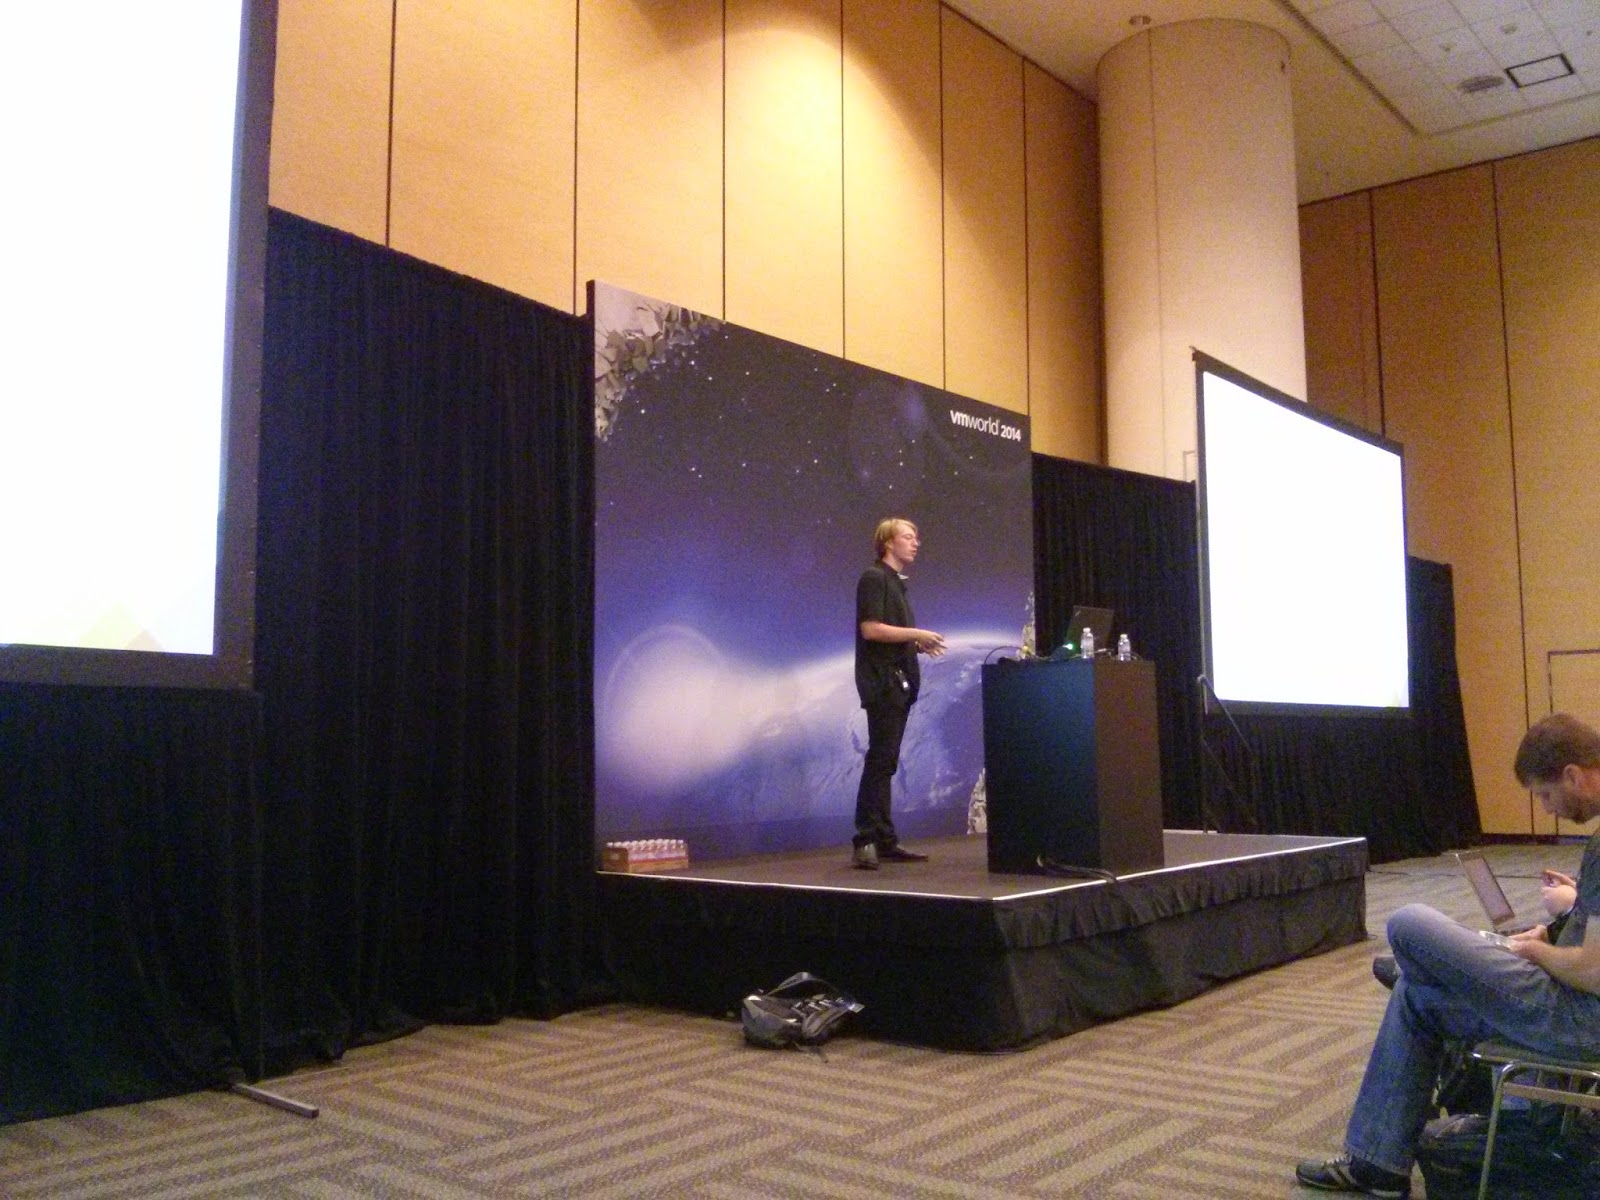
VMworld 2014/Virtual SAN Best Practices for Monitoring and Troubleshooting

Virtual SAN
Virtual SAN - software-based storage built into ESXi
- Aggregates local Flash and HDDs
- Shared datastore for VM consumption
- Distributed architecutre
- Deeply integrated with VMware stack
VSAN GA with ESXi 5.5 Update 1
RVC
RVC - started as a VMware Labs "Fling"
- Interactive command line, with lots of VSAN commands
- Included in VC since 5.5 (windows and appliance)
- Presents inventory as a file structure
HCL
Verify Hardware against VMware Compatibility Guide (VCG)
HCL Guides:
- vSphere general compatibility guide (Servers, NICs, etc)
- Virtual SAN compatilibyt guide - adpaters, Flash and HDDs
show adapters using RVC:
vsan.disk_info --show-adapters <cluster>/hosts/*
Virtual SAN HCL - http://vmware.re/vsanhcl
HCL steps:
- Step 1 - collect hardware information
- Step 2 - check HCL - http://vmware.re/vsanhcl
- Step 3 - verify your drivers
When viewing HCL entry, also check the "Class" and performance is important
Network
Network - Misconfiguration Detected
- VSAN requires 10GBe (or 1G dedicated)
- Single L2 network among ESX hosts
- IP Multicast
Show ESX configuration:
esxcli vsan cluster get
RVC: vsan.cluster_info <cluster>
Ensure all hosts have VSAN vmknic configured
WebClient: host -> manage -> networking -> vmkernel adapters
esxcli vsan network list
RVC: vsan.cluster_info <cluster>
Ensure VSAN vmknics are on right subnet
WebClient: host -> manage -> networking -> vmkernel adapters
esxcli ?
RVC: vsan.cluster_info <cluster>
Ensure Multicast is configured
tcpdump-uw -i <vmknic> udp port 23451
tcpdump-uw -i <vmknic> igmp
Issues
VM shows as non-compliant / inaccessible / orphaned
- non-compliant - maybe one mirror down
- inaccessible - really bad
- orphaned - VC has forgotten about the VM
VSAN object accessible:
- at least one RAID mirror is fully intact
- quorum: more than 50% of components need to be available (witnesses count here)
RVC Reports
VSAN RVC state reports:
vsan.vm_object_info <vm>
vsan.disks_stats <cluster>
vsan.obj_status_report <cluster>
vsan.obj_status_report --filter-table 2/3 -print uuids <cluster>
vsan.cluster_info <cluster>
vsan.resync_dashboard <cluster>
vsan.check_state --refresh-state <cluster>
vsan.disks_stats <cluster>
vsan.check_limits <cluster>
Diagnostics
Use the vSphere Web Client - the C# desktop client doesn't show VSAN or VSAN errors
VM Provisioning Started Failing -
- don't use: Cluster - Manage - Settings - Disk Management (where dissk were setup, it is not the right place to check disk health)
- Use: monitor - virtual SAN - physical disk
Proactive approach, try creating vm on every host on the cluster:
web client: standard method
rvc: diagnostics.vm_create -d <statstore> -v <vmfolder> <cluster>
VMware believes in "Dog Fooding" - have many internal VSAN clusters running
Benchmarking
VSAN Observer (vsan.observer in RVC)
- collects stats every 60 seconds
- web interface
- HOL Plug: check out VSAN Observer Hands On Labs
Outstanding IO chart in Observer is a good indicator that SSD speed is not sufficient (affects latency)
VSAN implements a priority traffic scheduler
Good References
Webinars on Monitoring/Troubleshooting:
- How To Monitor Virtual SAN (VSAN) - YouTube - https://www.youtube.com/watch?v=rHofTkK6K40
- How to Troubleshoot Your Virtual SAN (VSAN) - YouTube - https://www.youtube.com/watch?v=ASL3WVqy65o
VMware Blogs:
- RVC series:
- Managing Virtual SAN with RVC: Part 1 - Introduction to the Ruby vSphere Console | VMware vSphere Blog - VMware Blogs - https://blogs.vmware.com/vsphere/2014/07/managing-vsan-ruby-vsphere-console.html
- VSAN blog:
- Official VMware Virtual SAN Blog Index | VMware vSphere Blog - VMware Blogs - https://blogs.vmware.com/vsphere/2014/07/official-vmware-virtual-san-blog-index.html
- VMware Virtual SAN Quick Monitoring & Troubleshooting Reference Guide - https://communities.vmware.com/servlet/JiveServlet/previewBody/25934-102-2-34323/VMware_Virtual_SAN_Quick_Monitoring_Reference_Guide.pdf
Community Blogs:
- Troubleshooting, Automation, Nested ESX: http://virtuallyghetto.com/category/vsan
- All kinds of things VSAN: http://vmwa.re/vsan
